
Sampling distribution of Hosmer-Lemeshow statistic
Dobson and Barnet(2008) in their generalized linear models (GLM) textbook, say:
The sampling distribution of \(X_{HL}\) has been found by simulation to be approximately χ2(g − 2).
In this post I check out this statement:
library(generalhoslem)
## Loading required package: reshape## Loading required package: MASSset.seed(50)
NREP = 500
n_obs = 100
statistic_values <- array(0,NREP)
for (i in 1:NREP){
x <- rnorm(n_obs, 1, 1)
beta <- c(0.1,0.2)
y <- rbinom(n_obs, size = 1, prob = (1/(1+exp(-(beta[1]+beta[2]*x)))))
fit4 <- glm(y ~ x, family = binomial())
hoslem <- logitgof(y,fit4$fitted.values)
statistic_values[i] = hoslem$statistic
}
mean(statistic_values)
## [1] 8.168053var(statistic_values)
## [1] 13.93862qqplot(statistic_values, rchisq(500,8))
abline(0,1,lty=2)
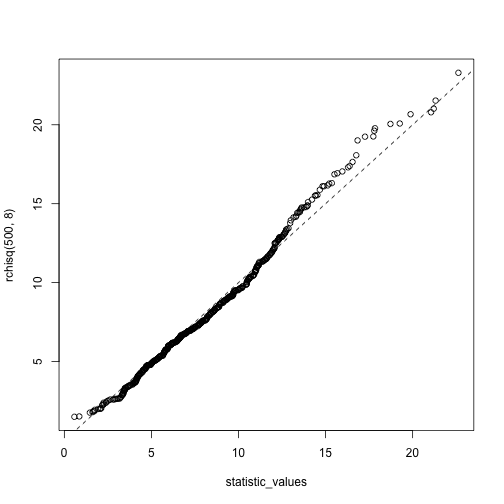
This qqpolt compares values of the statistic with chi-square(df=8) and we can confirm that this statistic has distribution of chi-square with (g-2) degrees of freedom.